
A Comparison of the 2019 BTC Bull Cycle to Our Current Market Structure
- Why Litecoin

- Feb 20, 2022
- 3 min read
We've been talking about the similarities between the market structure in 2018-2019 and the market structure of 2022, but I wanted to put everything together in one article for easier reference. So let's start.
Let's begin with the variables that most heavily impact market prices. The fed and narratives around tightening/loosening monetary policy have historically been the most significant driver of where asset prices are headed going forward. Pictured below is the high yield corporate bond index ($HYG). This is an important index to keep tracking because the fed is also tracking it very closely and has reversed their rate hikes/tapering when credit spreads start to widen.

As you can see, HYG is starting to roll over. In 2018-2019 the fed reversed course and stopped the rate hike narratives. Will the fed do something similar this time around? I think so.
Look at this survey from December 2018 when rate hike expectations for 2019 were still at 2-3. What did the fed actually do? They cut rates.

This doesn't mean the same thing will play out today because we do have much higher CPI numbers, but it is interesting that most did not expect cuts so they didn't even ask the question.
Now let's get into the Bitcoin market's supply dynamics. Below is the Bitcoin Long-Term Holder Net Position Change chart which tracks accumulation and distribution.

Notice the similarities in accumulation and distribution in 2018-2019 and the market of late.
Looking at the Bitcoin Optix Sentiment Index we can see the similarities between 2019 and 2022:
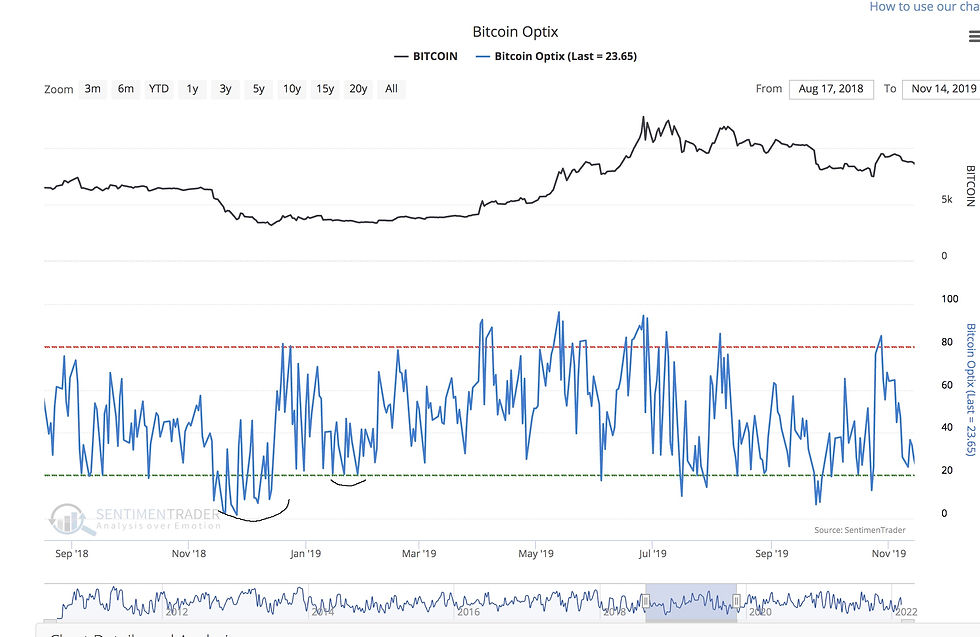
The similarities are marked in black on the above and below images. 2022 looks to be on an accelerated time scale.

Moving over to price charts, take a look at the similarities in RSI and price:

We formed a double top, followed by a near full retrace in price. The RSI dipped just below the 40 level indicated by the white markings on the chart.

Similarly in 2022, we just crossed under 40 on the RSI after forming a double top.
What's even more peculiar is the CME charts which depic similar price gaps and subsequent fills on a similar structure:

See how we gapped up to form a top and then had a major red candle down to fill? This same type of set up is what just has happened this weekend when Bitcoin dropped to $38,000.

We will open with a gap down. So the question is will we slowly work our way towards filling that gap over the coming weeks creating momentum and eventual breakout?
If we're going to follow a similar structure in terms of percentage move then we will see around a 400% move from around the $30,000 resulting in a price of around $120,000. But what about time scales? When can we expect this to happen based off of the similarities we just mentioned?
It appears that this recent drop and recovery is occurring at about just under 2x the speed. The picture below shows a 139 day rally from the bottom to top.

So taking our 2x speed time scale into consideration and applying it to where we're at today we get a projected top to occur around the first half of May, 2022.

Fundamentally, what drove the massive 400% move in 2019 was largely due to bearish sentiment that manifested as high short interest and eventual squeeze effects + retail interest that came as a result of the positive momentum.
Because of the recent bearishness and lack of liquidity across markets today, we could see a similar type of short squeeze that could give us the momentum needed to garner lots of interest. There are also many potential bullish news that could be making their way to the headlines soon, so we'll just have to wait and see.
One other indicator of confluence I'd like to share is the distance between local tops and lows that have taken place over the last year and a half. This chart is from @TradingRoomApp

We'll continue monitoring how this develops. Anything is possible, but it's hard to ignore the similarities.
Do you guys think we'll continue to follow this fractal? Why or why not?
Let me know if you guys have found any other similarities to 2018-2019 that you find interesting and I'll share them!
Thanks,
Why Litecoin


Comments